The Brokerage Stats widget provides a real-time view of brokerage activity, showing the current status of loads across key categories.
This widget helps you quickly understand overall performance and identify where attention is needed based on load status.
Use this widget to:
Monitor accepted, declined, and pending loads
Identify trends or shifts in brokerage activity
Filter and review brokerage data by status, type, division, or timeframe
Access detailed records for follow-up or analysis (future enhancement)
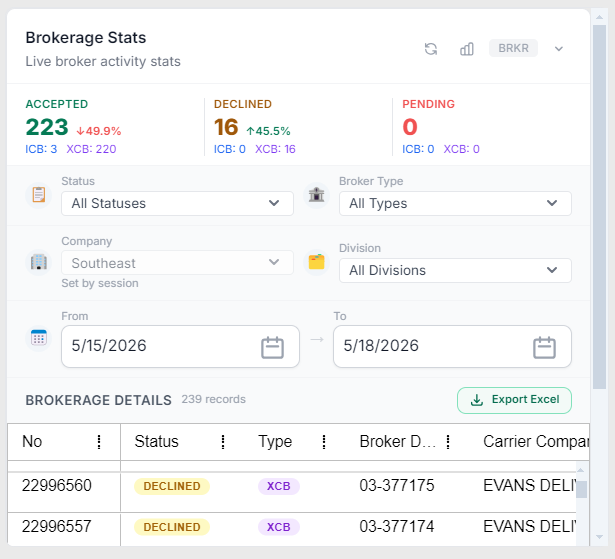
Brokerage Stats widget showing status summary, filters, and brokerage detail grid
Displays key brokerage metrics:
Accepted
Total number of accepted loads
Includes percentage change indicator
Declined
Total number of declined loads
Includes percentage change indicator
Pending
Total number of loads still awaiting action
Additional details:
Sub-values (e.g., ICB / XCB) provide breakdowns by broker type
Percentage indicators show directional change
Use filters to refine the data displayed:
Status
Filter by load status (Accepted, Declined, Pending, etc.)
Broker Type
Filter by type (e.g., ICB, XCB)
Company
Limits results to a selected company (session-based default may apply)
Division
Filters by operational division
From / To Date
Defines the date range for brokerage activity
Displays individual brokerage records based on selected filters.
Each row includes:
No – Order number
Status – Current load status (e.g., Declined)
Type – Broker type (e.g., XCB)
Broker ID – Broker identifier
Carrier Company – Assigned carrier
Carrier Pro - ICB division Pro or XCB carrier 01 Pro
Visual indicators:
Status labels are color-coded for quick identification
Rows reflect the currently applied filters
Refresh icon
Updates the widget with the most recent data
Export Excel
Exports the current filtered dataset
Record Count
Displays the number of records returned
Start with the Status Summary
Compare Accepted, Declined, and Pending counts
Use percentage indicators to identify changes or trends
Select a Status or Broker Type
Adjust Division or Company if needed
Set a date range
Review filtered results in the grid
Review the Brokerage Details Grid
Identify records needing follow-up (e.g., Declined loads)
Use the record details for next steps in your workflow
This widget is designed for monitoring and analysis, not just task execution
Filters impact both summary totals and grid results
Status breakdowns help identify operational trends quickly
Export can be used for reporting or deeper review